


Technical Analysis
Technical Analysis is a vast subject and it is virtually impossible to confine it into few pages. Objective of this Article is to show the retail clients the right approach towards the market and to establish that they should utilize the four basic tools collectively. Therefore, a basic idea about Technical Analysis might inspire them to study technical analysis in detail. However, there are number of theories and indicators in technical analysis and a retail client does not really need to assimilate the subject in its entirety for trading purposes, rather they need to know a few basic concepts which could be useful for trading.
Technical Analysis is an integral part of trading – intraday or short term basis. Until and unless your capital is big enough and your modus operandi is purely long term investment in nature, you must consult technical analysis for being a successful trader. However, you need to find answers to two main questions – what is technical analysis and how to apply it in your trading.
Simply put, technical analysis is the study of market action of securities on a chart (in the form of various kinds of bars / candles) and detecting different patterns and indicators to assess and forecast the future price trends. While a lot of people have little information about technical analysis, very few really know how to apply it.
At the outset, you have to keep in mind that Technical Analysis is not astrology or a prediction tool. The primary function of Technical Analysis is to show the current demand supply position of any particular Stock or Index, based on the current price action, define risk and reward of each particular trade and then help in analyzing the trend. In Technical Analysis, principal assumption is that, anything which is known to the market and can affect the market price of securities is actually reflected in the price of that security and that is reflected in the chart. Conversely, information not known to the market is not reflected in the chart. So, what needs to be done is to watch the chart closely, visualize the pattern and analyze the demand supply scenario and trend with the help of various indicators and studies.
Technical Analysis consists of two components – Chart and Theory behind the Chart. Charts are demonstrated by software, various kinds of software are available for this purpose. However, how to operate the charting software is not all about technical analysis, you must know the theory behind it. Unfortunately, it has been observed that majority of amateur retail traders quickly open the charting software and start viewing the charts, without having any knowledge on technical analysis. They do so because operating the software is easier than acquiring knowledge on the theories but that does not serve any purpose.
Numbers of Technical analysis tutorials have been mushroomed here and there. You need to be very selective in this regard. One thing you need to keep in mind that theory is essential but without implementation in practical trading it is useless. Only analysis of historical charts does not serve the purpose, you must utilize the theory to predict future price trends and for practical trading purposes.
Importance of Technical Analysis
While fundamental analysis may provide a gauge of financial statement analysis, economic statistics and other related data, there is no psychological component involved in such analysis. Yet the markets are majorly influenced by emotions. A drop of emotion could be equivalent to gallons of facts. Technical Analysis is the only mechanism to measure the emotional component present in the markets.
Second, Technical analysis is also an important component of disciplined trading. Discipline helps mitigate the nemesis of all traders, namely, emotion. As soon as you have money in the market, emotions are in the driver,s seat and rationale and objectivity are merely passengers. If you doubt the presence of emotions in markets, try paper trading and then try trading with your own funds. You will soon discover how deeply the counterproductive aspects of tension, anticipation, and anxiety alter the way you trade and view the markets – usually in proportion to the funds committed. Technicals can put objectivity back into the system, providing a mechanism to set entry and exit points, risk reward ratio and stop/out levels.
It is human nature, unfortunately, to see the market as we want to see it, not as it really is. A trader buys. Immediately the market falls. Does he take a loss? Usually he does not. Although there is no room for hope in the market, the trader will glean all the fundamentally bullish news he can in order to buoy his hope that the market will turn in his direction. Meanwhile prices continue to descend. Perhaps the market is trying to tell him something. Such messages of the market can be monitored using technical analysis.
Following technical analysis is important even if you do not rely on it and do not apply, simply because at times, technicals are the major reason for a market move. Therefore, as a market moving factor, this should be watched.
We shall discuss few theories of technical analysis which are most essential for trading:
- Candle Sticks and Candle Stick Patterns
- Chart Patterns
- Moving Averages
- Trend Lines
- Fibonacci
- RSI
- Candle Sticks and Candle Stick Patterns
- Chart Patterns
- Moving Averages
- Trend Lines
- Fibonacci
- RSI
Candlestick & Candlestick Pattern
Compared to traditional bar charts, candlestick charts are more visually appealing and easier to interpret. Each candlestick provides an easy-to-decipher picture of price action. Immediately a trader can compare the relationship between the open and close as well as the high and low. The relationship between the open and close is considered vital information and forms the essence of candlesticks. Hollow candlesticks (or white candle stick with blue border or whatever color you may fix in your software), where the close is higher than the open, indicates buying pressure. Filled candlesticks (or Black or Red Solid or whatever color you may select in your software), where the close is less than the open, indicates selling pressure.
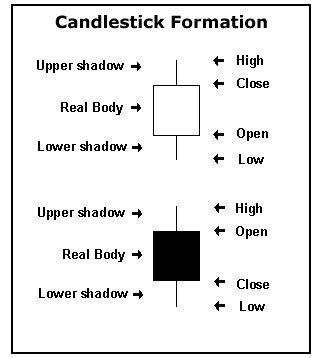
There are two more categories of Candle Sticks – Where day’s closing is higher than day’s opening but lower than previos days closing (should be hollow but with different color) and similarly where day’s closing is lower than day’s opening but higher than previous day’s open (should be filled but with different color).
There are several picturesque terms used to describe the patterns, in Candle Stick technique. Wouldn’t the expression “hanging-man” spark your interest? This is only one example of how Japanese terminology gives candlesticks a flavor of their own and, once you get a taste, you will not be able to do without them.
However, like every other technique, Candlestick is also having some limitations.
Candlesticks do not reflect the sequence of events between the open and close, only the relationship between the open and the close. The high and the low are obvious and indisputable, but candlesticks cannot tell us which came first.
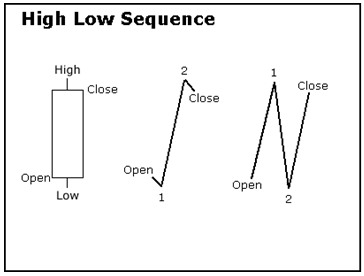
With a long white candlestick, the assumption is that prices advanced most of the session. However, based on the high/low sequence, the session could have been more volatile. The example above depicts two possible high/low sequences that would form the same candlestick (candlestick shown on the left side). The first sequence (which is given in the middle) shows two small moves and one large move: a small decline off the open to form the low, a sharp advance to form the high, and a small decline to form the close. The second sequence (which is given on the right) shows three rather sharp moves: a sharp advance off the open to form the high, a sharp decline to form the low, and a sharp advance to form the close. The first sequence portrays strong, sustained buying pressure, and would be considered more bullish. The second sequence reflects more volatility and some selling pressure. These are just two examples, and there are hundreds of potential combinations that could result in the same candlestick. Candlesticks still offer valuable information on the relative positions of the open, high, low and close. However, the trading activity that forms a particular candlestick can vary.
Another problem, although not of Candle Stick method only, drawing the individual candlestick chart lines requires a close. Therefore, you may have to wait for the close to get a valid trading signal. This may mean a market on close order may be needed or you may have to try and anticipate what the close will be and place an order a few minutes prior to the close. You may also prefer to wait for the next day”s opening before placing an order. This aspect may be a problem but there are many technical systems which require a closing price for a signal. This is why there is often a surge in activity during the final few minutes of a trading session as computerized trading signals, based on closing prices, kick into play. Some technicians consider only a close above resistance a valid buy signal so they have to wait until the close for confirmation. This aspect of waiting for a close is not unique to candlestick charts.
However, during the trading hour, before closing, you may require the probable shape of the daily candle, in order to get an idea of next day’s trend. For this purpose, you need to have real time basis charting software which would provide intraday chart as well as real time chart on daily and other time frame. Only EOD chart may not serve your purpose fully.
Among several Candlestick patterns, readers might explore few very important patterns, in detail, from their own resources, since here scope is limited to discuss individual patterns at length. Those are:
Hanging Man / Hammer, Doji, Bullish / Bearish Engulfing, Harami / Inside Day, Morning Star / Shooting Star / Evening Star, Spinning Top, Tweezers Top / Bottom, Double Top / Bottom.
Just keep in mind, the location of the candle and the prior trend is very important, in order to come to any conclusion. Further, always wait for confirmation of any pattern i.e, follow up candle, to take any trading decision because nothing is certain and fool proof and there are numerous examples of failure of the patterns.
Continue..